Manufacturing KPIs are clearly defined metrics designed to track, analyze, and enhance production processes. These indicators focus on aspects such as quantity, quality, and cost, providing manufacturers with critical insights to meet their organizational goals.
Settings Sheet
This sheet is the central hub for configuring database operations. It includes:
· Product Details: Configuration of product names, cycle times, required workers, and defect costs.
· Operating Lines: Details of each production line.
· Operating Shifts: Scheduling and shift information.
· Root Causes of Failures: Historical failure data and predicted failure scenarios.
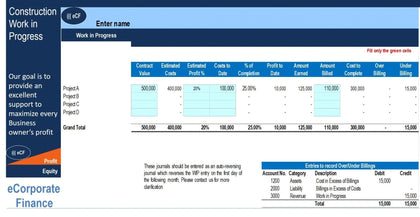
Database Sheet
The Database sheet is used to record periodic production and manufacturing data. It serves as a structured repository for essential operational information, including:
· Date and Event: Input daily or periodic production details.
· Production Shift: Select the appropriate shift.
· Product Name: Choose the product from the list.
· Operating Line: Specify the production line.
· Actual Running Time: Enter the actual time of operation.
· Planned and Unplanned Downtime: Document any downtime and choose from the root cause list if applicable.
· Production Quantities: Record the number of OK and defective units.
· Breakdowns: Log any breakdowns.
Note: Enter data in the white columns only; gray cells are functional and should not be modified. Add new entries in the last row.
Calculator Sheet
This sheet features a rapid manufacturing calculator toolkit that simplifies the computation of manufacturing metrics, aiding in more efficient analysis.
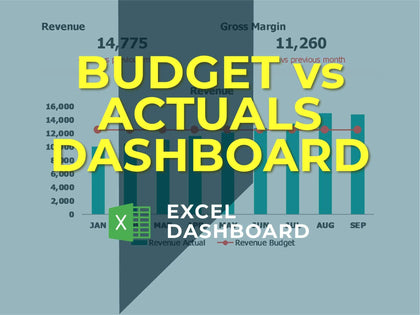
Dashboard Sheet
The Dashboard provides a comprehensive view of KPI analysis and trend visualization. It enables informed decision-making with detailed insights into operational performance.
Data Update: Press `Alt > A > R > A` to refresh data automatically.
KPIs and Trends: KPIs are calculated automatically and can be adjusted using slicers for dynamic data analysis.