1 PowerPoint Slide, 2 Excel Files Dataset and 1 POWER BI File PBIX
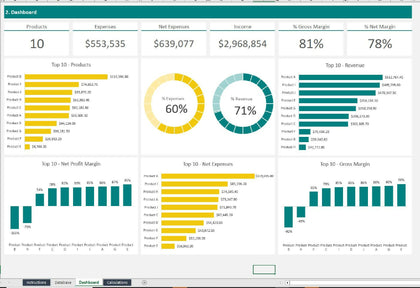
Power BI is a business analytics service by Microsoft. It aims to provide interactive visualizations and business intelligence capabilities with an interface simple enough for end-users to create their own reports and dashboards.
Microsoft Power BI is a business intelligence platform that provides non-technical business users with tools for aggregating, analyzing, visualizing, and sharing data. Power BI's user interface is fairly intuitive for users familiar with Excel and its deep integration with other Microsoft products makes it a very versatile self-service tool that requires little upfront training.
Common uses of Power BI
Microsoft Power BI is used to find insights within an organization's data. Power BI can help connect disparate data sets, transform and clean the data into a data model and create charts or graphs to provide visuals of the data. All of this can be shared with other Power BI users within the organization.
Today, Microsoft updates the Power BI application with new features and improvements on a monthly basis. To get the updates, users can download the latest edition from the Power BI site or Windows 10 users can get Power BI Desktop from the Windows Store.